Materials and methods
Summary
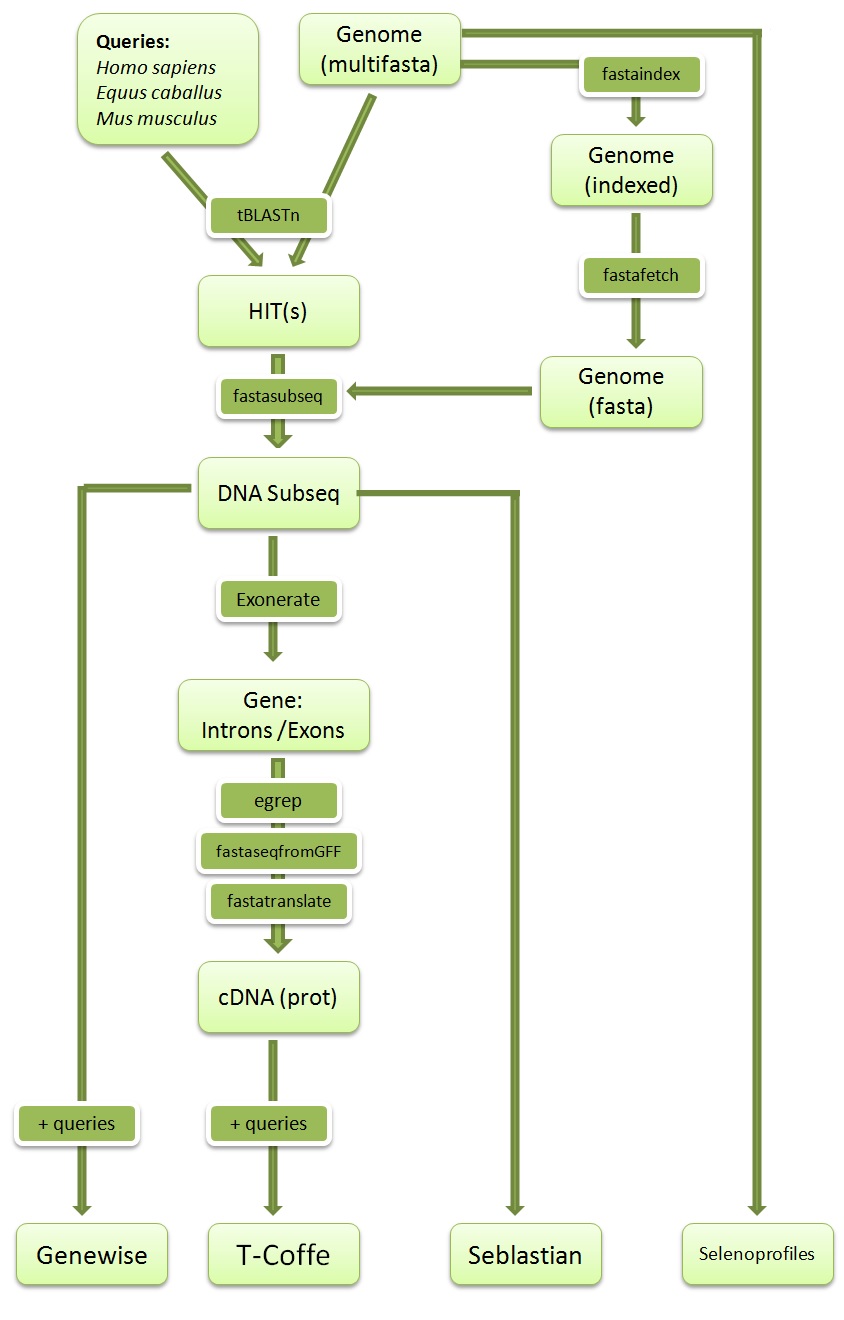
We present here a schematic overview of the adopted computational pipeline. First, we extracted all the selenoproteins and machinery proteins from Homo sapiens, Mus musculus and Equus caballus as our queries. Blast was used to identify genomic regions presenting high-homology in Ceratotherium simum’s genome. Second, we extracted the subsequence corresponding to each hit. Then, we run gene-structure prediction programs: GeneWise, Exonerate and Seblastian which is specialized in predicting selenoproteins and SECIS elements. The cDNA sequence was extracted and translated from the exonerate output file, selecting the exons with egrep and fastaseqfromGFF. This final predicted protein sequence from Ceratotherium simum was compared with the initial query using T-Coffe. In parallel, we executed selenoprofiles for Ceratotherium simum’s genome, a program designed to predict selenoproteins from a given sequence. In addition, we scanned the genome for the presence of the selenocysteine tRNA using the software tRNAscan-SE. Finally, four analysis outputs were obtained; from GeneWise, T-Coffe, Seblastian and Selenoprofiles. The comparison of these four results for each query and the gene prediction by exonerate was developed on our discussion for each selenoprotein and machinery protein found.
Genome
The genome of Ceratotherium simum (White Rhinoceros) was sequenced by The Broad Institute of MIT and Harvard on 30th of July, 2012. It is available online in the following link (GenBank Assembly ID: AKZM00000000.1).
However, the genome has been previously updated to the corresponding folder from the course. We accessed to it through the following command from the shell:
Queries
As described, we performed a homology-based approach to find selenoproteins and machinery proteins in Ceratotherium simum which requires a priori information of known selenoproteins. We selected three different species to be used as a model, comparing them with our genome: Homo sapiens, Mus musculus and Equus caballus.
Homo sapiens was selected because it presents the best studied-genome and therefore, the most accurate annotation. Consequently, the best complete and accurate annotation of selenoproteins was also from Homo sapiens. Selenoproteins have been described to remain much conserved through the evolution thus; they will show high homology generating exhaustive and reliable results to analyze.
Mus musculus was selected in order to be used as a control for the information extracted with Homo sapiens queries. Even though selenoproteins are highly conserved, the phylogenetic distance between rhino and human is significant and this will cause variability. It is distant specie from the Homo sapiens in the phylogeny and both organisms are equally distant from the Ceratotherium simum. For this reason, the selenoproteins from Mus musculus will present variability with the Homo sapiens ones. This variability can be useful to contrast the obtained information from Homo sapiens and understand the evolutionary variability originated when analyzing data from Ceratotherium simum’s genome. Furthermore, Mus musculus has a very well annotated genome because it is a highly recurrent used model in science.
Equus caballus was selected because of its proximity in the evolution with Cerathoterium simum; they are very philogenetically close species. For this reason, it is a very appropriate organism to use as a query; their selenoproteins present less variability with Ceratotherium simum.
The queries were obtained from SelenoDB 2.0 (Romange et al., 2013). It is a database that provides high-quality annotations of selenoprotein genes, proteins and SECIS elements. SelenoDB 2.0 contains more than one file for each human selenoprotein, corresponding to the different possible isoforms of a certain protein. We used all those isoforms in our analysis but specially focusing in the sequence corresponding with SelenoDB 1.0 (Castellano et al., 2007) because those have been manually annotated. The selenocystein was annotated with the character U in the query, consequently the execution of exonerate –one of the following programs in our methods-was aborted or it produced an error. Hence, we developed a simple Perl program that changes the character U for the character X in every query. To see the program:UX.pl
Here we can see the image in which there are the filogenetic relaitons among all mammals. We have represented the different animals that we have used in this study with different colors in the tree: Homo sapiens in blue, Mus musculus in yellow, Equus caballus in green and Ceratotherium simum in red.

Blast
BLAST (Basic Local Alignment Search Tool) is an algorithm for comparing primary biological sequence information, such as the amino-acid sequences of different proteins or the nucleotides sequences of DNA. A BLAST search enables a researcher to compare a query sequence with a library or database of sequences, and identify library sequences that resemble the query sequence above a certain threshold. More information can be found at BLAST’s official webpage.
We used tBLASTn because it compares a protein sequence –our queries– with a nucleotidic database sequence –Ceratotherium simum’s genome–. tBLASTn translate nucleotide sequences in all six potential ORFs (Open Reading Frames) to compare them with the query and then show homologies found from hits. The alignments show potential regions that can encode for a selenoprotein.
INPUT: Query expressed as a protein sequence.
Genome -Ceratotherium simum-
First of all we need to run blastall exons:
cp /cursos/BI/bin/ncbiblast/.ncbirc
Then we can run blastall:
- -p: Specifies the type of the search (tblastn: specifies that it is a protein alignment, where nucleotide database is translated input protein before the search).
- -i: Specifies input query file.
- -d: Specifies the target database(s).
- -m: 9
- -m: Specifies alignment view. 9: tabular with comment lines and post search sorting.
- -o: specifies output file
OUTPUT: file containing the list of the hits found. For each hit, the scaffold ID, the e-value, the starting position and the ending position were stored for our analysis.
The hits are the regions from the genome that present high-similarity with the query. The significance is evaluated with the e-value parameter, which describes the number of hits expected to find only randomly. A given scaffold was accepted with an e-value lower than 10-3 (1 out of 1.000 to find the hit by chance).
Extracting the sequences of interest from the genome: fastaindex, fastafetch and fastasubseq
Once we obtained the Blast output, it was used to extract the genomic subsequence corresponding to each hit. Blast's local alignment algorithm usually found more than one hit per scaffold. They are presented as individual hits that correspond to different exons or highly identical portions between the query and the genome. Hence, we merged all those hits in order to extract them as a single unit. Of note, the interval between the minimum q.start and the maximum q.end of each scaffold was elongated at both ends by 50.000 nucleotides. Using that methodology we ensured that the subsequence extracted from the genome did not only contain all the hits found by a given query but also a significant content of surrounding nucleotides. Three programs were executed from the shell in order to perform the extraction of sequences from the genome:
- Fastaindex
The original format of the genome file was not indexed. Thus, two more steps were necessary in order to convert the genome in the appropriate format to work with; indexing and transforming to fasta format. Those actions can be executed with the following commands from the shell, respectively:
INPUT: un-indexed genome in fasta format.
fastaindex genome.fa genome.index
OUTPUT: indexed genome in fasta format.
- Fastafetch
It is used to extract the sequence of a particular scaffold from a given genome. It can be executed from the shell with the following command:
INPUT: blast’s output file (a file with the list of the hits found)
fastafetch genome.fa genome.index “scaffold_name” > fastafetch.fa
“scaffold_name” Specified scaffold name to be extracted from the multifasta file. Example: gi|398923055|gb|JH767752.1|.
OUTPUT: the complete scaffold from a selected hit (or group of hits).
- Fastasubseq
It is necessary to extract only the target sequence from a given hit (or set of hits) and discard the rest of the scaffold that we have selected. It can be executed with the following command from the shell:
INPUT: the complete scaffold from a selected hit (or group of hits).
fastasubseq fastafetch.fa start_position length > subsequence.fa
Start_position Specifies the beginning of the target sequence. Length Specifies the dimension of our target sequence.
OUTPUT: the target subsequence beyond the start and the final position of the blast hit (or group of hits).
Exonerate
Exonerate is a tool used for gene prediction from our subsequence of the genome region containing a homologue protein of our query. It predicts the protein structure including exons and introns. It can be executed from the shell with the following command:
INPUT: Query expressed as a protein sequence.
Fastasubseq’s output; the target DNA subsequence
We need to run exonerate export:
Then, we can run exonerate program:
- -m p2g
- -m: Specifies alignment model type. p2g: protein to genome.
- -showtargetgff Creates gff format output.
- -q Specifies query sequence as a fasta format file.
- -t Specifies target DNA subsequence as a fasta format file.
OUTPUT: GFF file containing an annotation of the gene; exons and introns.
We are also interested in extracting the cDNA of the predicted protein from Ceratotherium simum's genome. Hence, two more commands need to be run:
Egrep. This command is used to select the exons from our previous exonerate file that contains the whole sequence of the gene. It can be executed from the shell using the following command:
INPUT: exonerate’s output: GFF file containing an annotation of the gene; exons and introns.
- -w exon
- -w: To select all lines that contain an exon (patron).
FastaseqfromGFF. Then, we need to extract the corresponding cDNA sequence. To do it, we execute the perl script called fastaseqfromGFF.pl
INPUT: egrep’s output file.
To run fastaseqfromGFF.pl we need to run exports:
Before that, we can run fastaseqfromGFF.pl
OUTPUT: It generates an output file that contains the cDNA sequence: the exons of the predicted protein.
Fastatranslate This command will translate the sequence, obtaining an amino-acid sequence as an output. It can be executed from the shell using the following command:
INPUT: cDNA of the predicted protein.
-F 1 Indicates the reading frame to translate (1-6).
OUTPUT: aminoacid sequence of the predicted protein.
Genewise
GeneWise (Birney et al., 2004), like exonerate, is a tool for gene prediction that uses similar protein sequences thus, it was used to contrast the data obtained from exonerate. However, GeneWise uses an exhaustive algorithm.
To run this program, we need to export some commands:
GeneWise can be executed from the shell using the following command:
INPUT: Query expressed as a protein sequence. Fastasubseq’s output; the target DNA subsequence
- -pep To show predicted peptidic sequence inside the output.
- -pretty To show pretty ASCII alignment.
- -cdna To show the predicted cDNA sequence aligned.
- -gff To create the output of gene prediction in GFF format.
- -both
OUTPUT: an alignment of the query with the predicted protein from the DNA subsequence.
T-Coffee
T-Coffee. Is a multiple sequence alignment package (Notredame et al, 2000); it can align protein, DNA and RNA sequences by using dynamic algorithms. In our study, we used T-Coffee to compare predicted proteins, homology during the evolution in mammals and homology inside protein families.
To run this program we need to do the next export:
And then we run t-coffee:
We used this program to compare the different predicted proteins and then, select the one which was more alike to the inicial query. It was also used to copare the different predicted proteins on the cases that the queries for the three animals predicted different proteins on the same scaffold. We used these T-Coffees as a control to see that, even thought the different queries predicted different sequences, these were from the same protein in C.simum. We affirmed this when the T-Cooffes showed really high scores of alignment, which happened almost all the times.
We also used T-Coffee for making several multiple sequence alignment to analize the homology of the studied proteins, among different mammals and among the different proteins from the same family. We used these results to complement our data.
Automation program
To automatize the annotation process, we have created a bash program that allows us to realize all exports and run all commands before mentioned.
Click the command to observe the script: Automatice
The second one chooses the scaffolds that have the e value less than 10e-3 and execute the next commands.
Click the command to observe the script: UNTUBU.pl.
Seblastian
SECIS Search 3 and SEBLASTIAN (Mariotti et al., 2013) are computational methods for selenoprotein identification and analysis: SECISearch3 is a tool for prediction of eukaryotic SECIS elements. Seblastian is a new method for selenoprotein gene detection that uses SECISearch3 and then predicts selenoprotein sequences encoded upstream of SECIS elements. Seblastian is able to both identify known selenoproteins and predict new selenoproteins.
We completed our analysis with those tools in order to contrast and discuss the obtained data from our program. The target subsequence was introduced and the prediction submitted online. The webserver can be found here: http://seblastian.crg.es
It is remarkable to point that SECIS Search 3 is a very sensible program; it detects all the SECIS elements. Nevertheless, it is not specific; it produces some false positives thus, the number of SECIS elements predicted is normally much higher than the real number of existing SECIS elements. For example, when examinating a protein that has lost its selenocystein, SECIS Search 3 is likely predicting the SECIS element anyway. For this reason, we only accepted those SECIS predictions that were accompanied of a selenoprotein prediction by SEBLASTIANwhich means that they presented a selenocystein on the sequence.
Selenoprofiles
Selenoprofiles is a pipeline for profile-based protein prediction in genomes. It takes at two inputs: a profile of alignments of a given protein family and a genome, in which will search the protein family in order to make predictions.
First of all we proceed to download and install the executable, only possible in a concrete cluster of PCs in the campus and after downloading, installing and compiling the executable mafft, not given properly installed. Once we have linked all the slave programs that Selenoprofiles will need we proceed to run the installation with the following code line:
- -full used to perform a full installation of the program, in which it will be linked to a huge database from NCBI
- -drdb to link a file named names.dmp to the correspondent location in the program structure.
- -nrdb to link one file existent in our computers (the nr.fa database) to the correspondent location in the program, thus avoiding the download of such a huge file.
After the proper installation of the program, we proceed to run it against the all genome using the profiles given –which presumably contain all the selenoproteins families described- with the following code line:
- -s To define the specie.
- -debug To avoid a forced stop of the program if any bug is detected. What will happen is that a new text window will emerge with information about the bug and possible solutions, where you will be able to change the parameters and then keep the program running.
- -merge
The two last options are included for: 1) to not stop the program if there is any bug and 2) to not start from the beginning but from the last files generated.
After the instructions are set, the program will start its pepilen, consistent in what follow:
- Psitblastn used together with a PSSM derived from the profile alignment to select the matches with the given genome (can be considered as an extension, because allows the use of relative positions in the query building)
- These matches are filtered and processed by two splice alignment programs: exonerate and Genewise
- The predictions are used to choose only one. Some modification procedures may be performed. Finally, it generates an output with the estimate prediction. However, this program could hardly be distinguished from ours, but Selenoprofiles it’s improved in a filter line. Therefore, what make them difference is the filtering. Three different steps of filtering are described: blast filtering (we also have it); p2g filtering and refiltering, AWSI filter. Thus, a conserved profile will only output a well-conserved sequence. SECISearch is used as well.
Interestingly, and in the same line as we have concluded in our work, the query selection plays an important role in getting the correct output information. Therefore, what this program tries to generate is a master query, which results from by the most present aminoacid at each position of the alignment. For that reason, often we are not able to see the real query but a BLAST MASTER QUERY, which is the consensus sequence predicted as the most informative from the queries contained in the profile.
Finally, it is important to highlight some problems that we had using Selenoprofiles, basically concerning GPx evaluation, where a bug was detected. It consisted in the incapacity to read some of the blast outputs, and hence missing some of the outputs –this may explain why we have not found all the members of the GPx family-. It also gives a wrong output in the DI3 protein, the literature and all the methods used predicted one exon less than the predicted with Selenoprofiles.
tRNA SCAN
tRNAscan-SE identifies transfer RNA genes in genomic DNA or RNA sequences. The output is generated as a result of the combination of the Cove probabilistic RNA prediction package with the speed and sensitivity of tRNAscan 1.3. Moreover, it has an extension which includes an algorithm to search for eukaryotic pol III tRNA promoters.
Without going deeply, the search of tRNAs is based in some principles:
- Looking for short, well-conserved intragenic promoter sequences
- identification of the various stem-loops structures described in tRNAs “clover leaf”, considering as well the presence of concrete base-pairing in the stem, correct loop size, and several invariant and semi-invariant bases
- finally, an empiric threshold is set and the accumulative score is evaluated against the score. If it’s higher, the program prints the predicted tRNA, if not, the program reject it.
What we did was download the executable form of the program found in http://lowelab.ucsc.edu/tRNAscan-SE/ and we proceeded to install it: first changing the Makefile to establish the direction of the different programs needed; then compiling and installing it.
- -G To use a general tRNA model, which select the original tRNA covariance model that was trained on tRRNAs from all three phylogenic domains.
- -o To generate the final file with the output results.
Pseudogene prediction
Pseudogenes are dysfunctional relatives of genes that have lost their protein-coding ability or are otherwise no longer expressed in the cell. Sometimes they have evolved as a result of accumulation of multiple mutations occurred in genes that are not essential for survival. The importance of this DNA is not surely defined, although it is known that in some occasions its functional.
However, predicting pseudogenes is not a simple issue. In our work we have tried to predict some pseudogenes based in the follow principles: first, we started with sequences with certain homology with the queries but with have not been assigned to any known protein, thus meaning that the unassigned hit has some homology with our selenoproteins. Although certain homology is required to predict pseudogenes with our system, it is not enough to identify pseudogenes. In fact, some of these hits will be duplications of certain domains, where the conserved homology is great but there is not in-frame ORF nor stop codons or start codons. Once selected the precises hits that can be pseudogenes, we need to go deeply in its features. Typically, we can look for frameshifts or ORF-disruptions which can be due to mutations of start/stop codons. Moreover, we can also try to analyzes the intron/exon structure. Usually, the pseudogenes are not under evolutive selection, and therefore they could accumulate mutations, and some of then can affect the concrete splice sites, thus affecting the intron structure. Hence, we can see some pseudogenes which has different exons analyzes together as a result of this disruption in the intron structure. Linked with this, we can look for the dN/dS score, which will be close to 1 as there is no evolutive pressure in those regions, and therefore their mutation index will be random. However, it is important to take into account that this data is not always true, as some pseudogenes can be of interest and therefore better conserved.
To conclude, it is important to highlight that although we have tried to precisely predict these pseudogenes, it is only an approximation that should be improved in order to confirm our results.