Iron Response ElementS
![]() METHODS, PROCEDURE
AND RESULTS
METHODS, PROCEDURE
AND RESULTS
![]()
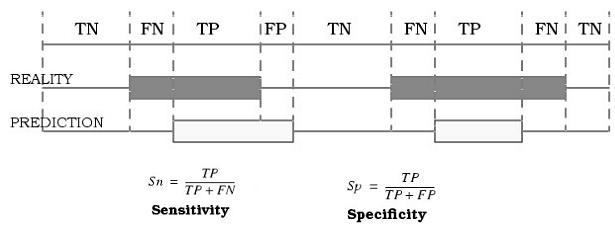
![]() ASSESSING SENSITIVITY AND SPECIFICITY
ASSESSING SENSITIVITY AND SPECIFICITY
At this point resulted interesting to define sensitivity (Sn) and specificity (Sp) for each pattern because in this way we could know how numerically how strict our predictions were and consequently how realiable the results obtained were.
In this concrete problem, sensitivity (Sn) is defined as the rate betwwen the number of correct structures founded by Patscan and the number of actual structures. So that sensitivity can let us know the percentage negative falses obtained.
At the opposite site we found specificity (Sp), that is defined as the number of correct structures founded by PatScan between all the number of structures founded by PatScan. It can provide us the rate of falses positive obtained.
Patterns sensitivity and specificty estimations:
TRANSFERRIN:
Sn: 4 / (4+0) = 1
Sp: 4 / (4+0)= 1
These results suggest we have a really strict and selective transferrin pattern. With this we will not be able to recognize either structures that are not the proteins we are looking for or proteins that although belong to the family searched contain few variations with regard to the pattern.
FERRINTIN:
Sn: 7 / (7+1) = 0,87
Sp: 7 / (7+0) = 1
These results show us that the ferritin pattern is really selective but not as strict as the first one.
ACONITASE:
Sn: 4 / (4+0) = 1
Sp: 4 / (4+0) = 1
Again this pattern is pretty strict and selective. Like in the transferrin pattern we will not recognize either structures that are not our molecules or those with few variations when compared to the pattern.
FERROPORTIN:
Sn: 4 / (4+1)= 0,8
Sp: 4 / (4+0)= 1
In this case sensitivity and specificity show us that the ferroportin pattern is really selective pattern but not as strict as transferrin or ferroportin.

![]()
