|
In this project we will talk about the protein number 2, a fusion protein that is codified by the genes Moz and Ashx2. These two genes are expressed in two separated chromosomes and translate two different proteins. However, sometimes Moz is translocated and it is fused to Asxh2 what may cause an alteration in histone acetylation, resulting in the development of therapy-related Myelodysplastic Syndrome (tDMS). This syndrome is an adverse effect of successful acute myeloblastic leukemia treatment and its symptoms develope 17 months after the treatment. Spectral karyotyping analysis detected a chromosomal translocation at t(2;8)(q23.2;q11.2) and fluorescence in situ hybridation analysis suggested a rearrangement in the monocytic leukemia zinc finger (MOZ gene). This gene has HAT activity (histone acetyl transferase), which plays fundamental roles in regulating chromatin structure, remodeling, transcription and other nuclear processes in leukemogenesis.
Results
The results we got are explained in separate parts that are genomic structure characterisation, homology study, gene expression, gene promotor region study and functionality.
a) Genomic structure characterisation
Moz gene
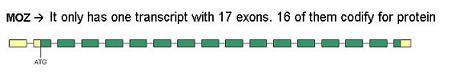
MOZ gene is also known as MYST3 (MYST histone acetyltransferase 3). It is located at the chromosome 8, p11. It only has one transcript.
Transcript 1: It has 17 exons. The first exon and half of the second and half of the last one do not codify for protein. Then, only 16 exons are codify and translate a protein with 16 exons and 13 of them are used to make our fusion protein.
Figure 1. In this picture, Moz exons are coloured. Yellow colour means not codifying region and green colour means codifying region.
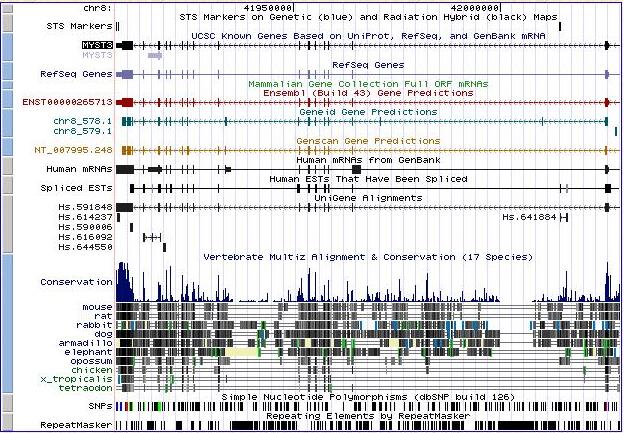
Figure 2. In UCSC we found out how many transcripts had each gene and we shared with ensembl information. It confirmed that Moz is a gene with only one transcript, located at chromosome number 8. In UCSC we also got more information about homology, gene expression and conservative domains that we will explain later. In this grafic we can see that at the beginning of the gene sequence there is a significative conservation between some species like mouse, rabbit, rat, dog, armadillo and others.
Asxh2 gene
ASXH2 gene belongs to the group of polycomb proteins and is also known as ASXL2 (additional sex combs like 2). It is located at the chromosome 2, from p23.3 to p24.1. This gene has two transcripts:
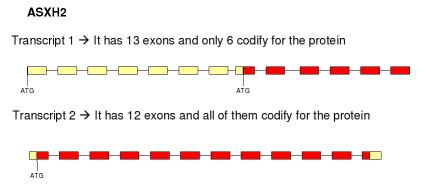
Figure 3. In this picture, Asxh2 exons are coloured. Yellow colour means not codifying region andred colour means codifying region.
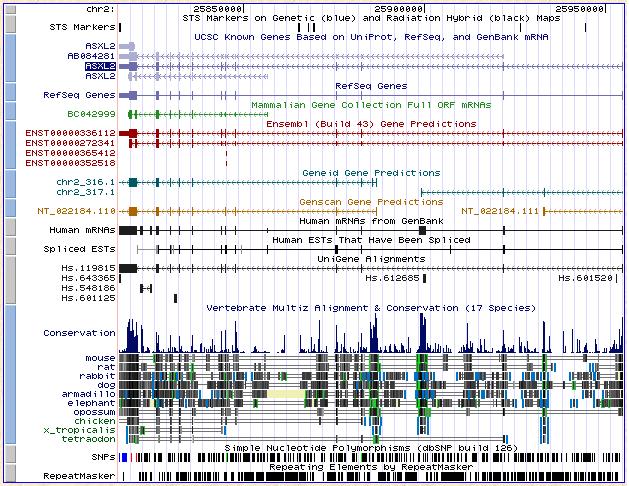
Figure 4. UCSC shows that in Ensembl this gene had 4 transcripts but in Ensembl we found only 2. UCSC confirmed that Asxh2 gene had 2 transcripts. It is located at chromosome number 2. In this grafic we can see that there are 3 places very conservated beetwen the same species as Moz. It happens at the beginning and twice in the middle of gene sequence.
Relation between two transcripts:
Moz - Asxh2 fusion
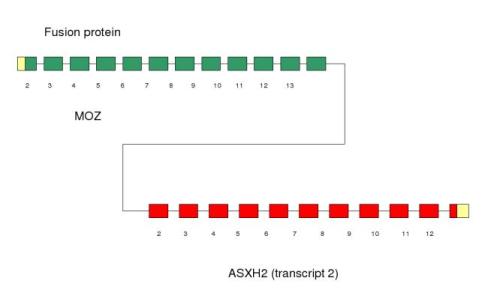
Figure 5. This fusion protein is expressed in bone narrow in a pediatric case of therapy-related myelodysplastic syndrome (t-MDS). Moz gene on chromosome 8p11.2 was found to be rearranged to the 2p23 locus. Exons 2-14 of the Moz gene are fused to exons 2-13 of the Asxh2 due to t(2;8)(p23.3;p11.2).
Moz gene has only one transcript, so it has only one isoform. Asxh2 gene has two alternative transcripts and we can see that they have different number of exons. Therefore we could say that there is alternative splicing. We have two isoforms that mantain the same open reading frame because the two transcripts are composed by the same codons. The differents isoforms afect codify and non-codify exons.
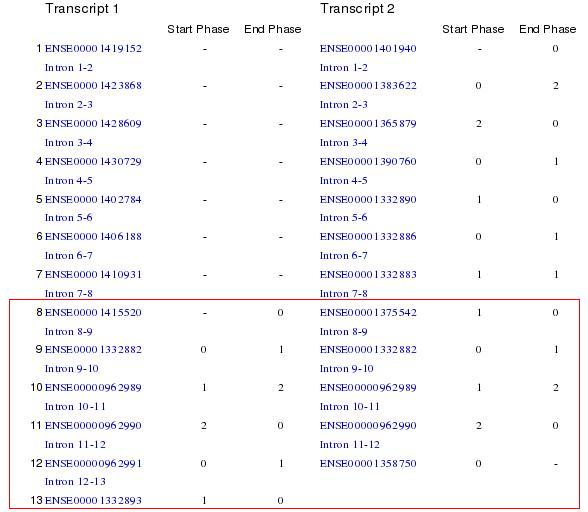
Figure 6. In this picture we can see that the open reading frame is the same in the two transcripts.
The fusion protein only considers the transcript number 2 of Asxh2 gene because the transcript number 1 is a part of transcript 2.
b) Homology study
We have studied all the ortolog species of each gene through Ensembl and Ncbi databases and it has been found out that Moz and Ashx2 genes are homolog to many common species. All of them are showed in the tables below.
Ensembl database
Ortolog species |
Moz gene |
Pictures |
Ortolog species |
Asxh2 gene |
||
Best Reciprocal Hit |
Pan Troglodites |
99% |
 |
Pan Troglodites |
99% |
Best Reciprocal Hit |
One to one |
Bos Taurus |
89% |
 |
Bos Taurus |
86% |
One to one |
One to one |
Rattus norvegicus |
88% |
 |
Rattus norvegicus |
74% |
One to one |
One to one |
Mus musculus |
88% |
 |
Mus musculus |
77% |
One to one |
One to one |
Echinops telfairi |
87% |
 |
Echinops telfairi |
71% |
One to one |
One to one (apparent) |
Canis familiaris |
83% |
 |
Canis familiaris |
77% |
One to one |
One to one (apparent) |
Macaca mulatta |
83% |
 |
Macaca mulatta |
96% |
One to one |
One to one |
Gallus gallus |
83% |
 |
Gallus gallus |
59% |
One to one |
One to one |
Tupaia belangeri |
82% |
 |
Tupaia belangeri |
82% |
One to one |
One to one |
Monodelphis domestica |
79% |
 |
Monodelphis domestica |
66% |
One to one |
One to one |
Loxondonta africana |
77% |
 |
Loxondonta africana |
62% |
One to one |
One to one |
Erinaceus europeaus |
75% |
 |
Erinaceus europeaus |
61% |
One to one |
One to one |
Dasypus novemcinctus |
68% |
 |
Dasypus novemcinctus |
81% |
One to one |
One to one |
Cavia porcellus |
65% |
 |
Cavia porcellus |
70% |
One to one |
One to one |
Ornithorhyncus anatinus |
65% |
 |
Ornithorhyncus anatinus |
60% |
One to one |
One to one |
Felis catus |
58% |
 |
Felis catus |
78% |
One to one |
One to one |
Danio rerio |
58% |
 |
Danio rerio |
35% |
One to one |
One to one |
Tetraodon nigroviridis |
58% |
 |
Tetraodon nigroviridis |
19% |
One to one |
One to one |
Takifugu rubripes |
56% |
 |
Takifugu rubripes |
32% |
One to one |
One to one |
Gasterosteus aculeatus |
54% |
 |
Gasterosteus aculeatus |
34% |
One to one |
One to one |
Oryctolagus cuniculus |
32% |
 |
Oryctolagus cuniculus |
66% |
One to one |
One to one |
Aedes aegypti |
9% |
 |
Aedes aegypti |
12% |
One to one |
One to one |
Xenopus tropicales |
59% |
 |
One to one |
Oryzias latipes |
36% |
 |
One to one |
Drosophila melanogaster |
25% |
 |
One to many |
Anopheles gambiae |
8% |
 |
One to many |
Ciona savigny |
7% |
 |
One to many |
Ciona intestinalis |
7% |
 |
One to many |
Saccharomyces cerevisiae |
6% |
 |
In the table, the first and the last columns explain the relation between two species compared. We found that Pan troglodites is the best ortolog for Moz and Asxh2 genes in Homo sapiens and the relation is reciprocal. It is the Best Reciprocal Hit.
The third and sixth columns explains the % homology, from more to less.
Here we have the two species ortologs shared by two genes.
Ortolog species |
Moz gene |
Asxh2 gene |
Pictures |
Pan Troglodites |
99% |
99% |
|
Bos Taurus |
89% |
86% |
|
Rattus norvegicus |
88% |
74% |
|
Mus musculus |
88% |
77% |
|
Echinops telfairi |
87% |
71% |
|
Canis familiaris |
83% |
77% |
|
Macaca mulatta |
83% |
96% |
|
Gallus gallus |
83% |
59% |
|
Tupaia belangeri |
82% |
82% |
|
Monodelphis domestica |
79% |
66% |
|
Loxondonta africana |
77% |
62% |
|
Erinaceus europeaus |
75% |
61% |
|
Dasypus novemcinctus |
68% |
81% |
|
Cavia porcellus |
65% |
70% |
|
Ornithorhyncus anatinus |
65% |
60% |
|
Felis catus |
58% |
78% |
|
Danio rerio |
58% |
35% |
|
Tetraodon nigroviridis |
58% |
19% |
|
Takifugu rubripes |
56% |
32% |
|
Gasterosteus aculeatus |
54% |
34% |
|
Oryctolagus cuniculus |
32% |
66% |
|
Aedes aegypti |
9% |
12% |
|
Ncbi database
Ncbi database and the results of Moz gene are in the table below.
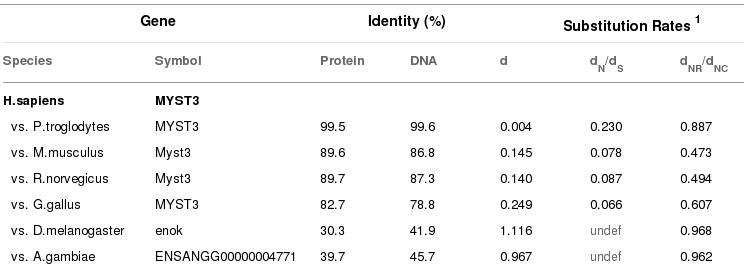
Figure 8. In this picture we see the homology between Moz gene of Homo sapiens and others species.
Ncbi has less ortolog species than Ensembl but all of them are very similar in their % homology. However, A.gambiae shows different results.
Ncbi database results of Asxh2 gene.
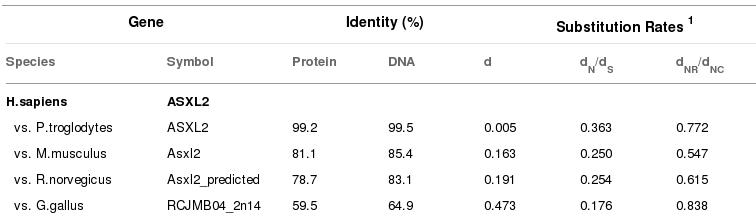
Figure 9. In this picture we see the homology between Asxh2 gene of Homo sapiens and others species.
Ncbi has less ortolog species than Ensembl but all of them are very similar in their % homology. However, R.norvegicus and M.musculus shows different results.
To study gene's evolution we built a tree of each gene. There are differences from Ensembl homology tables because in the trees all the sequences are compared to all sequences and in Ensembl just our sequence was compared to the rest.
It is important to say that there are species in Ensembl tables that are not on the phylogenetic trees. This is because some species were so far from the rest that the Mega program could not consider them to make the alignment.
Phylogenetic tree of Moz gene
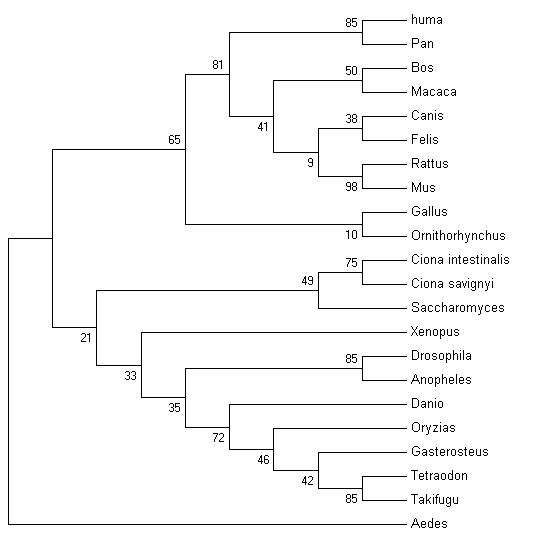
Figure 10. The numbers on the tree are the probability that the relation between species could be faithful. This tree is not very faithful because number sometimes are too low.
The more branch length the more separate are the species from Homo sapiens. Then, this phylogenetic tree shows that Moz gene in Homo sapiens is very similar to Moz gene in Pan troglodites and less similar in B. taurus and M. mulatta. The furthest specie is Aedes.
Phylogenetic tree of Asxh2 gene
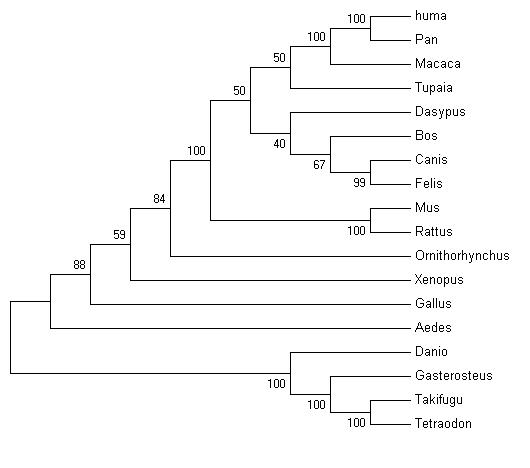
Figure 11. This phylogenetic tree shows that Asxh2 gene in Homo sapiens is very similar to Moz gene in Pan troglodites and less similar in M.mulata. The furthest species are Takifugu and Tetraodon.
c) Gene expression
Moz and Asxh2 have been studied separately because the protein fusion is only expressed when the myelodysplastic syndrome occurs. Red colour means high expression, green colour low, black colour means normal expression and when is no colour refers at the non gene expression.
The expression of Moz has been studied in normal tissues but Asxh2 is not expressed in normal tissues, so we had to study this gene in other database (GNF atlas 2).
High expression |
Low expression |
Normal expression |
Brain frontal cortex |
Thyroid |
Testes |
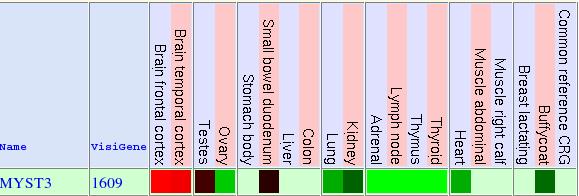
Figure 12. This table shows Moz gene expression in normal tissues. The information is in next link (Page in UCSC)
High expression |
Low expression |
Normal expression |
PB-CD4+ Tcells |
Heart Amygdala |
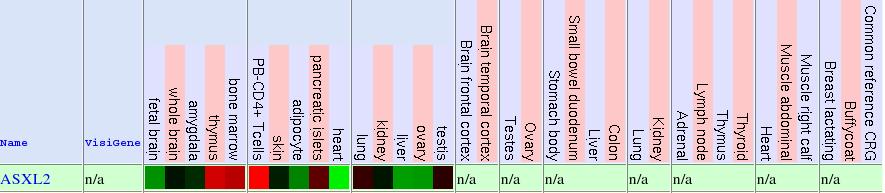
Figure 13. This table shows Asxh2 gene expression tissues. The information is in next link (Page in UCSC)
d) Gene promotor region
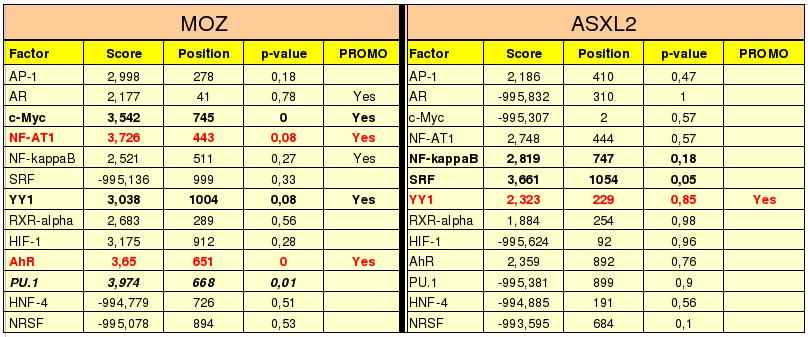
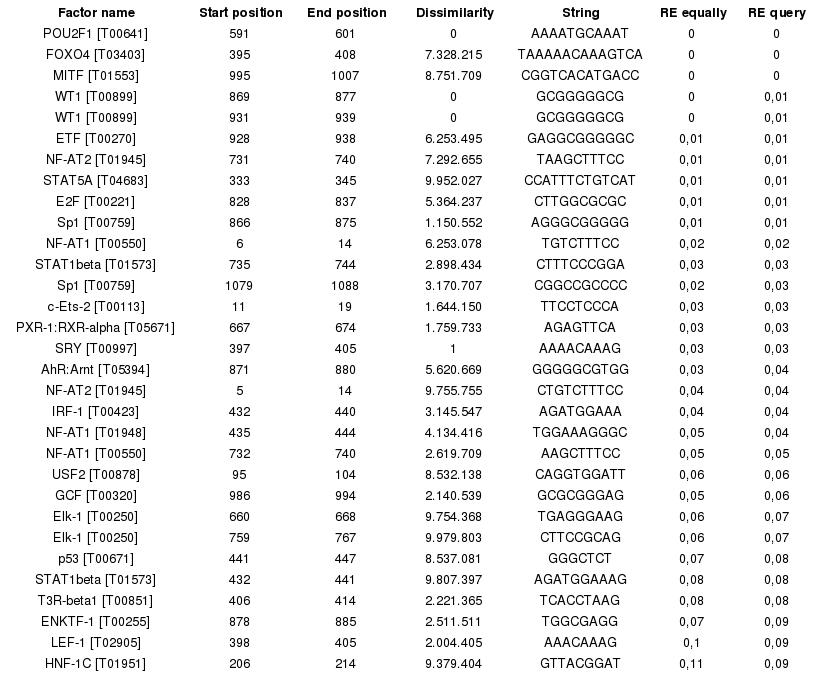
Figure 14. As we can see in the table, the four first columns correspond to the results of our program and the fifth column to the results of PROMO web page.
To select the transcription factors (TF's) first of all we choose the factors with low p-value and high score, because the score measures the union of the TF to the promoter sequence and explains if it is good or not. The p-value is the probability we can find the maximum score in random sequences, so low values show that the union of the TF to the promoter sequence is difficult to see by chance and then is reasonable to think that this TF binds to the promoter region. We have 5 TF's for Moz gene (NF-AT1, c-Myc, YY1, AhR and PU.1) and 2 for Asxl2 gene (NF-kappaB and SRF) with good score.
After this, we compare this results to the TF's proposed by PROMO.
The difference between RE query and RE equally is that RE query uses a sequence that has the same proportion of aminoacids as our sequence. However, RE equally uses a sequence that has the same random proportion of each aminoacid (25%). Therefore, we think that RE query suits better to our protein because it has the same proportion of aminoacids.
Finally we select the two factors in red bolds as probably transcription factors of Moz gene and the factor in red bold of Asxl2 gene.
The score, position and p-value of each factor has been calculated with the transcription factors prediction program.
To see the code click to this link. Program font code
e) Study of gene functionality
First of all we will study the functionality of each gene separately and then we will see when and what for is expressed the fusion protein.
1. Moz gene
1. Structural information
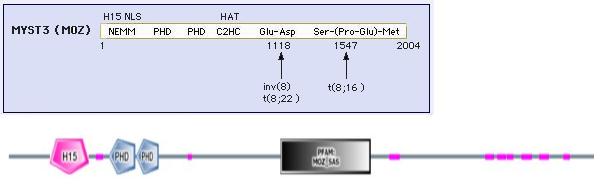
Figure 15. This pictures shows Moz gene domains
This gene is found in nucleus and codifies for a protein that has 2004 amino acids, 225 kDa. Its domains are:
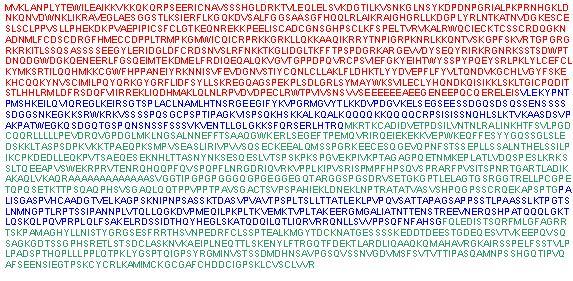
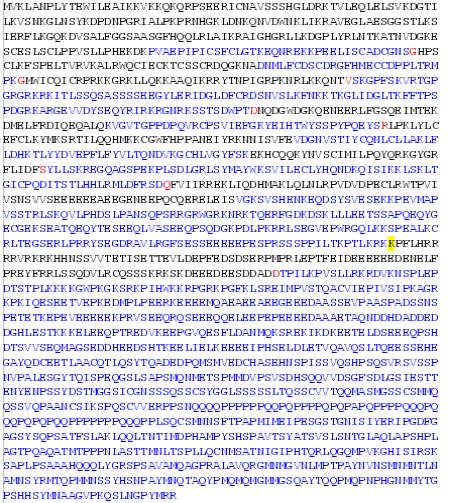
The following link shows Moz protein sequence, and the differents exons have different colours (blue and black). The breakpoint position is thought to be in the aminoacid number 1013 that is the first of the fifteenth exon and it has yellow colour. Moz breakpoint
2. Moz domain logos
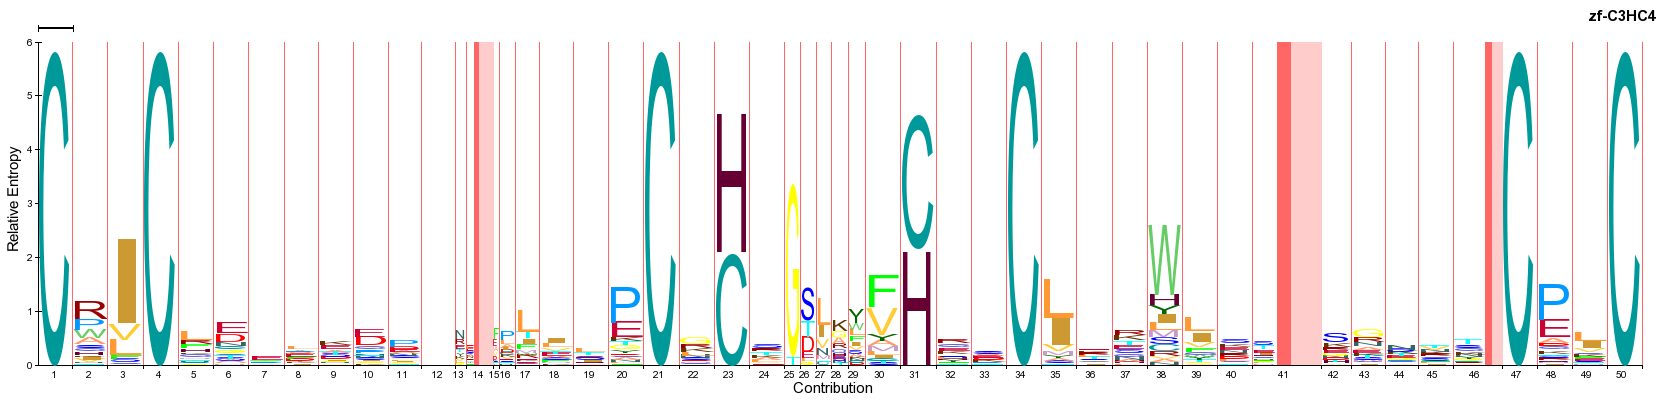
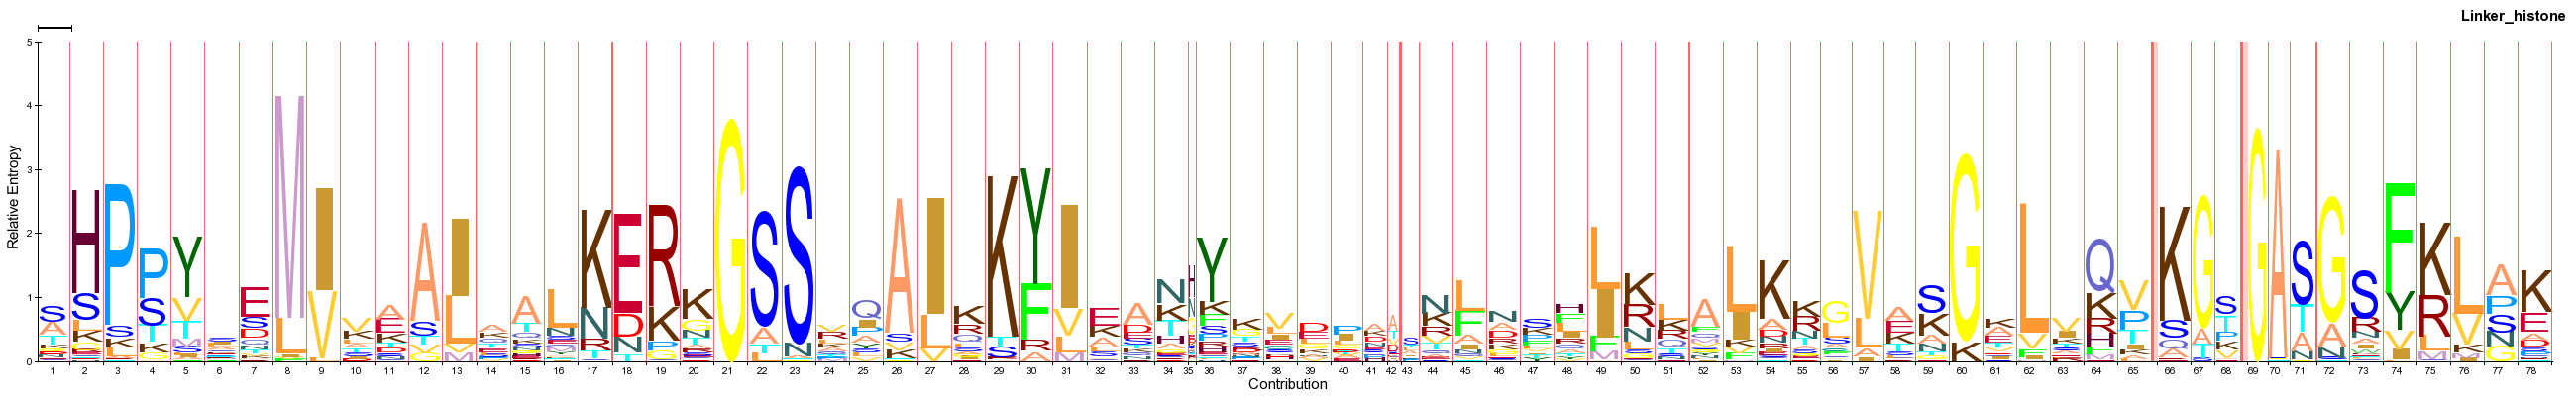
In Interpro inside Ensembl we found Moz domains. There, in pfam, we made the logos of 4 most important domains in this gene. The logos explain the aminoacid more conservated in every position. The higher is the letter the more conservated has been during the evolution.
Here you can find the logo of MOZ-SAS domain. MOZ-SAS domain
Here you can find the logo of PHD domain. PHD domain
Here you can find the logo of zinc finger domain. Zinc finger domain
Here you can find the logo of histone domain. Histone domain
3. Moz protein conservation
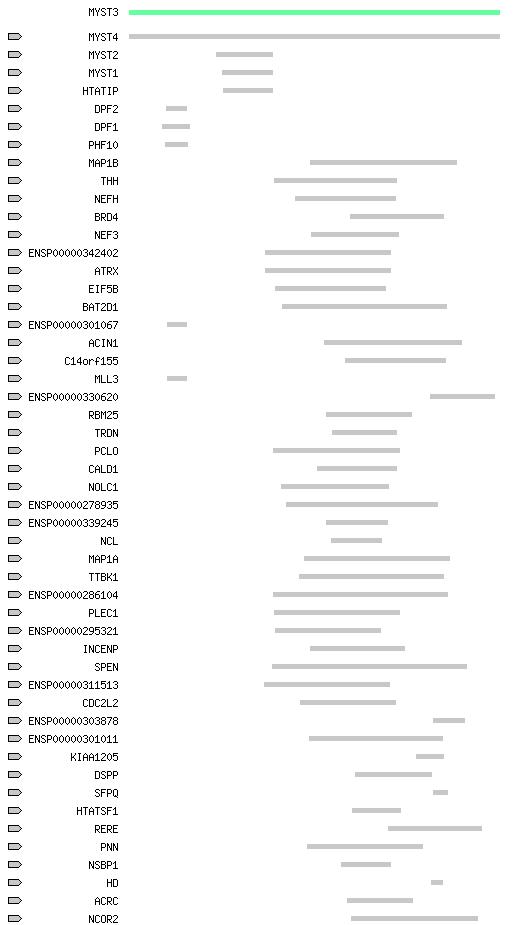
Here we show the conservation of Moz protein in human proteins.
In EMBL page we found a database called String and it gave to us some more information about the protein.
In next link there is shown the conservation of Moz protein with other human proteins. This protein is very similar from another of the same family; Myst4. There are another humans proteins that share only some regions. Human proteins
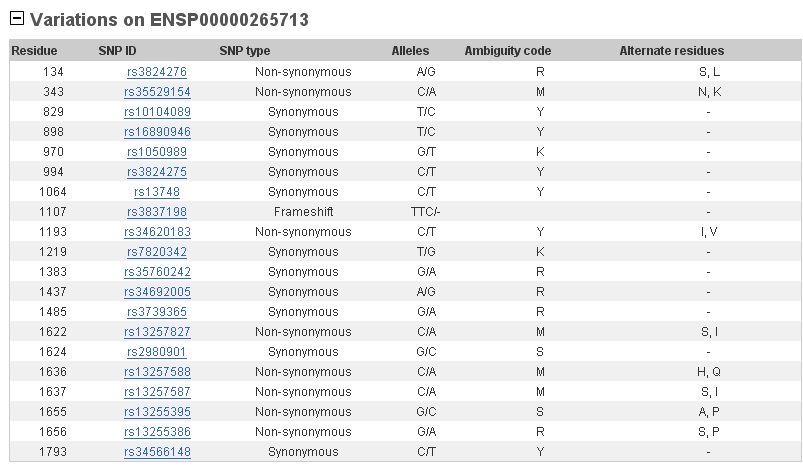
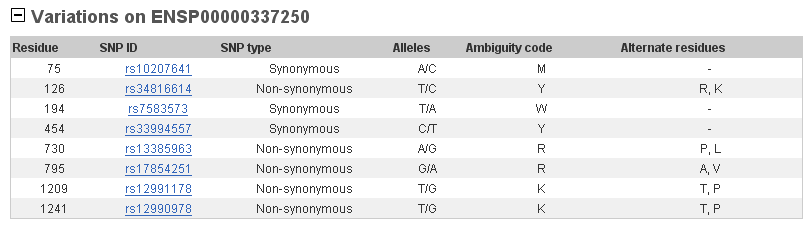
This gene presents some SNPs in its sequence what means that there are changes in one aminoacid. In the table below we can see that there are more synonymous changes than non-synonymous. This means that, although SNPs, aminoacids can be the same and probably they are important for the protein functionality.
4. Functionality
In gene ontology there are 3 functions described:
We have seen that this gene is envolved in some important biological processes like DNA packaging, histone acetylation, myeloid cell differentation, negative and positive regulation of transcription. That has been seen that when Moz is implicated in DNA packaging it can be associated to Asxh1l, one protein from Asxh2's family.
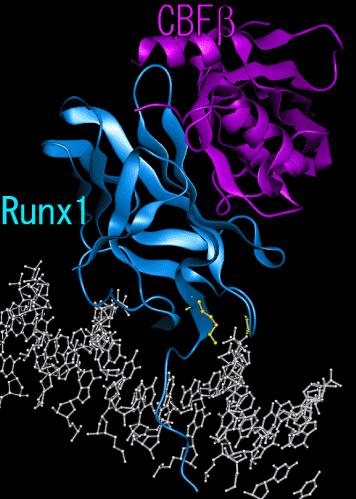
Moz has both transcription activation and transcription repression domains. The N-terminus is involved in transcriptional activation while the C-terminus is involved in transcriptional repression. Histone acetyltransferase may act as a transcriptional coactivator for Runx1 and Runx2.
2. Asxh2 gene
1. Structural information
Asxh2 is related to Asx Polycomb group proteins, implicated in embryogenesis and carcinogenesis through transcriptional regulation of target genes. ASXH1 is one of human homologs of Drosophila Asx. There has been a search for ASXL1-related gene within the human genome by using bioinformatics and identified the ASXL2 gene.
Human ASXL2 (1435 aa) showed 79.4% total-amino-acid identity with mouse Asxl2 (1370 aa), and 29.8% total-amino-acid identity with human ASXL1.
In Pubmed we found that Proteins from this family have three domains that were found to be conserved between human ASXL2 and ASXL1. However, this information does not correspond to the protein databases like Interpro, pfam, Uniprot...
In pfam we found that this gene has many low complexity domains and one coiled coil. Low complexity domains are blue in the picture and coiled coil is green.

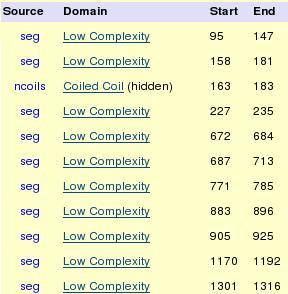
Figure 16. Asxh2 gene domains.
As we said before, we did not find any important domain in Asxh2 gene. For this reason, we could not do any logo.
3. Asxh2 gene conservation
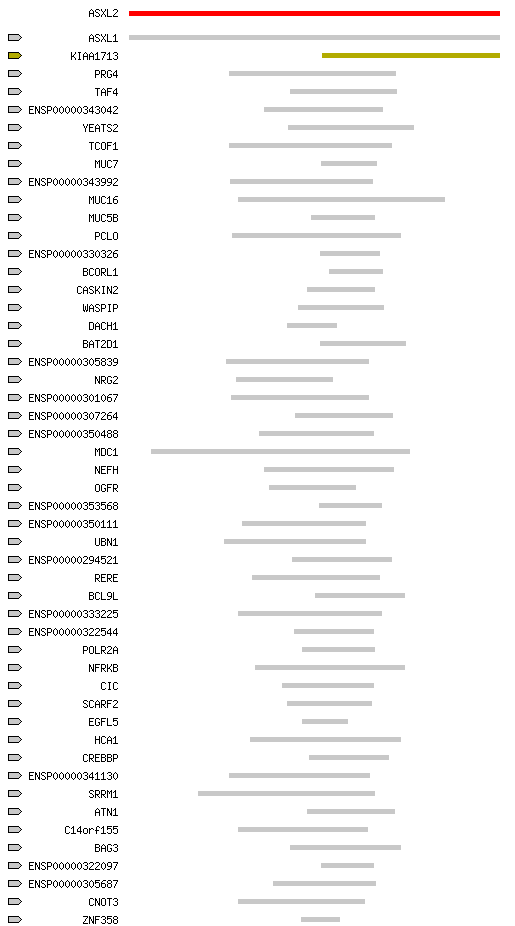
Here we show the conservation of Asxh2 protein in human proteins.
In EMBL page we found a database called String and it gave to us some more information about the protein.
In next link there is shown the conservation of Asxh2 protein with other human proteins. This protein is very similar from another of the same family; Asxh1. There are another humans proteins that share only some regions. Human proteins
This gene presents some SNIPs in its sequence what means that there are changes in one aminoacid. In the table below we can see that there are more non-synonymous changes than synonymous. This means that there are more changes in aminoacids, probably they are not important for the protein functionality.
Polycomb group and trithorax group proteins are implicated in embryogenesis and carcinogenesis due to transcriptional regulation of target genes through histone modification and chromatin remodeling. Based on functional conservation and human chromosomal localization, ASXL2 and ASXL1 genes were predicted cancer-associated genes. It is also important to say that drosophila Asx mutations exhibit anterior and posterior transformations and it has been studied that Drosophila Asx is one of the ETP (Enhancers of trithorax and Polycomb) genes with dual functions in transcriptional activation and silencing.
3. MOZ-ASXH2 fusion protein
1. Structural information
In UCSC we find that Chimeric Moz-Asxh2 protein fusion has four domains but in pfam we found that only has 2 and in interpro we found 6 different domains. Trying to make it clear we looked for some pictures that show Moz - Asxh2 fusion protein and we think that it has two PHD domains and HAT Moz-Sas domain from Moz gene and then it is fusioned to some low complexity domains of Asxh2 gene.
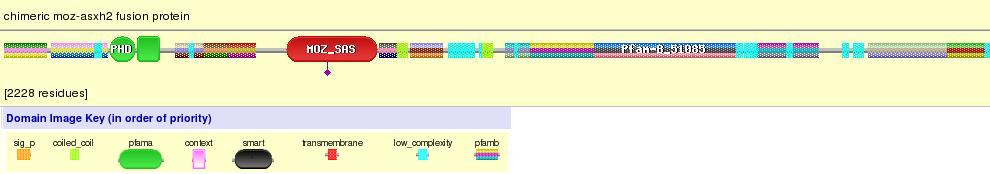
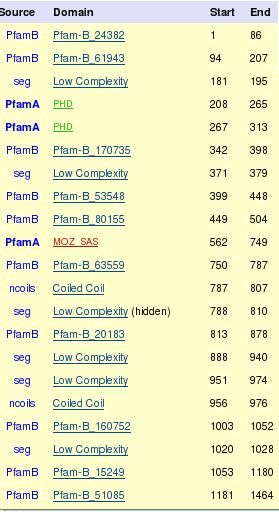
Figure 17. Chimeric Moz-Asxh2 fusion protein. We can see the two Moz domains (PHD and Moz-SAS) and the low complexity Asxh2 domains.
This fusion protein is expressed in bone narrow in a pediatric case of therapy-related myelodysplastic syndrome (t-MDS). MOZ gene on chromosome 8p11.2 was found to be rearranged to the 2p23 locus and exons 2-13 of the ASXL2 gene are fused to exons 2-14 of the MYST3 gene due to t(2;8)(p23.3;p11.2). By genomic cloning of the breakpoint, a novel fusion of the MOZ-ASXH2 was identified. Because MOZ also modulates transcription by regulating local histone acetylation, the MOZ-ASXH2 might cause the development of MDS through inducing an aberrant local chromatin structure and an abnormal gene expression.
It has one subunitat that is a component of the NuA4 histone acetyltransferase complex, that is involved in epigenetic transcriptional activation of selected genes principally by acetylation of nucleosomal histones H4, H3, H2B, H2A. Acetylation of histone H4 is essential for DNA double-strand break repair through homologous recombination.
Myelodysplastic syndrome (MDS) is a pre-cancerous disorder in which there is impaired production of the normal components of blood (white cells, red cells and platelets).
MDS is frequently associated with fatigue, shortness of breath, infection and serious bleeding and patients are at risk of developing frank acute leukemia.
Some individuals with MDS survive for years with little treatment required; others have complications relating to their low blood counts from the time of diagnosis, particularly if their white cell or platelet count is very low.
One of the best predictors of outcome in MDS is the chromosomal content of the bone marrow cells and this requires a bone marrow sample to be taken. This test is helpful in assessing whether a patient with MDS is likely to develop acute leukemia within weeks, months or years, a development, which is usually associated with more symptoms for the patient.
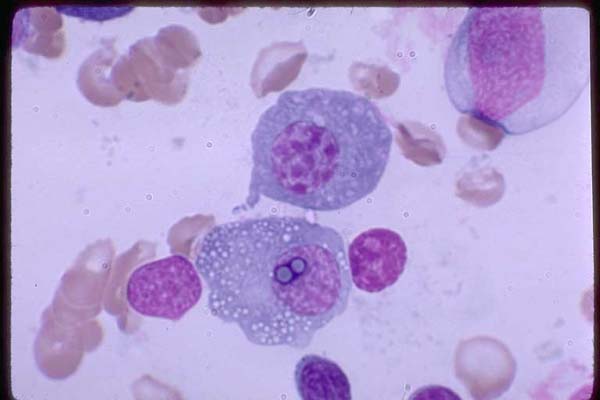
Figure 18. Two large plasma cells; one with multiples
vacuoles, two of wich are over the nucleus. Marrow 100X
First of all we did a Blast in Ncbi database with our protein number two. There we knew that our protein was a fusion protein and the gene names : Moz and Asxh2.
Then, we studied the gene structure, two both separately and later the fusioned genes. Using Ensembl we found all the information about transcripts, localisation and length of the genes and a little introduction to the genes functionality. We found out how many transcripts had each gene and how exons had each transcript. In exon information we found how many exons had each transcript and which of them were codify and non-codify and then which of them codified for our protein. It was also checked that joining two parts of the translated sequence of each gene was the same protein sequence as the protein number 2. Therefore, two genes were fusioned without insertion or delection. All the information in Ensembl was compared to UCSC genome browser to make sure it was right.
In transcript information we found that one gene had two different transcripts, and they had the same sequence but different codify exons. Then we knew that there was alternative splicing and then there were different isoforms. There we also found information about the open reading frame.
We studied homology in Ensembl, where we found the ortologs species of each gene. After that we made a table with the ortologs of each gene separately and another one with the ortologs shared. In this table we also explained the relation between species (one to one, one to many or many to many). All this information was compared to Ncbi databaser to make sure it was right and then we made another table with results achieved.
To study gene's evolution we built a tree of each gene. To do that, we got the sequences of every transcript of all ortologs found in Ensembl. After this we aligned these sequences with ClustalW and then we used Bioedit to transform it to fasta format. Finally, in Mega program we got mega format and the tree were obtained through Neighbour joining.
In Gene sorter in UCSC we studied Gene expression. We modified the brightness of the colours to see better in which tissues was expressed the gene. The expression of Moz has been studied in normal tissues but Asxh2 is not expressed in normal tissues, so we had to study this gene in other database (GNF atlas 2).
To characterise gene promotor region we first got promotor sequence upstream and downstream in UCSC of each gene. We pasted this sequence together in Promo with a dissimilarity factor unless 10%. There we obtaneid all transcription factors thant bound to our fusion protein.
After that we did a informatic program following the instructions done.
Through some web pages we found the domains of each gene. We explained the functionality of each domain and we built some Logos with Interpro. In EMBL page we found a database called String which gave to us some extra information about the whole protein of each gene. In Ensembl we found SNPs of each gene and we put this information into a table. In Gene ontology we found the functions of each gene and in Pubmed and web pages there was extra information about interactions and the disease Myelodysplastic syndrome (MDS).
In this project we will talk about the protein number 2, a fusion protein that is codified by the genes Moz and Ashx2. There is not much information about this protein and above all Asxh2 gene. The discussion we have arrived at is based on the only two scientific articles we found about these genes.
Moz gene
MOZ gene is located at chromosome 8, it only has one transcript, so it has only one isoform. This transcript has 17 exons which 16 exons codify and translate a protein. 13 exons are used to make our fusion protein.
This gene presents some SNPs in its sequence. There are more synonymous changes than non-synonymous. This means that, although SNPs, aminoacids can be the same and probably they are important for the protein functionality. Moz protein has five domains and it's very similar to Myst4.
We found that Pan troglodites is the best ortholog for Moz gene in Homo sapiens and the relation is reciprocal. NCBI has less ortolog species than Ensembl but all of them are very similar in their % homology. However, A.gambiae shows different results.In the phylogenetic tree Moz gene in Homo sapiens is very similar to Moz gene in Pan troglodites , B. taurus , M. mulatta and furthest similar to Aedes.
The expression of Moz has been studied in normal tissues and we found a high expression in brain frontal cortex and brain temporal cortex. The low expression was in thyroid, thymus, lymph node, adrenal, embryonic Stem Cells, ovary, lung, heart, kidney and buffycoat.
Moz gene has 3 functions described: acetyltransferase activity, histone acetyltransferase activity and transcription factor binding. We have seen that this gene is envolved in some important biological processes like DNA packaging, histone acetylation, myeloid cell differentation, negative and positive regulation of transcription.
About TF's, in the case of Moz gene selected TF's were NF-AT1 and AhR because they fits with the information we have.
Asxh2 gene
Asxh2 gene is located at the chromosome 2. Has two transcripts: one of this transcript has 13 exons and the other one has 12 exons. When it is translated it forms a protein with 12 exons, all of them are used to make the fusion protein. The fusion protein only considers the transcript number 2 of Asxh2 gene because the transcript number 1 is a part of transcript 2.
Asxh2 gene has two alternative transcripts and they have different number of exons. Alternative splicing producese two isoforms. Proteins from this family have three domains.
Pan troglodites is the best ortholog for Asxh2 gene in Homo sapiens. Asxh2 gene in Homo sapiens is very similar to Asxh2 gene in M.mulatta. The furthest specie is Takifug and Tetraodon.
The expression of Asxh2 was studied in GNF atlas 2 database. We found a high expression in PB-CD4+ Tcells, thymus, bone narrow and pancreatic islets. The low expression was in heart, adipocyte, fetal brain, ovary and liver.
Polycomb group and trithorax group proteins are implicated in embryogenesis and carcinogenesis due to transcriptional regulation of target genes through histone modification and chromatin remodeling.
In the case of Asxh2 gene the selected TF was one: YY1, although the high p-value.
Moz-Asxh2 fusion protein
The following link shows Moz protein sequence, and the differents exons have different colours (blue and black). The breakpoint position is thought to be in the aminoacid number 1013 that is the first of the fifteenth exon and it has yellow colour.Moz Breakpoint
We think that chimeric protein has two PHD domains and HAT Moz-Sas domain from Moz gene and then it is fusioned to some low complexity domains of Asxh2 gene. We have arrived at that conclusion after finding some pictures about this protein fusion and because MOZ modulates transcription by regulating local histone acetylation. Acetylation makes histones have more negative charges. DNA is also negatively charged, and then they repulse each other. Then, DNA cannot be packed and it makes transcription of other genes possible. We think that the translocation of Moz gene to chromosome number two plus this activity can make transcript some genes normally repressed and envolved in leukemogenesis. Therefore, the fusion MOZ-ASXH2 gene might cause the development of MDS through inducing an aberrant local chromatin structure and an abnormal gene expression. One sign of the abnormal expression is the presence of our protein.
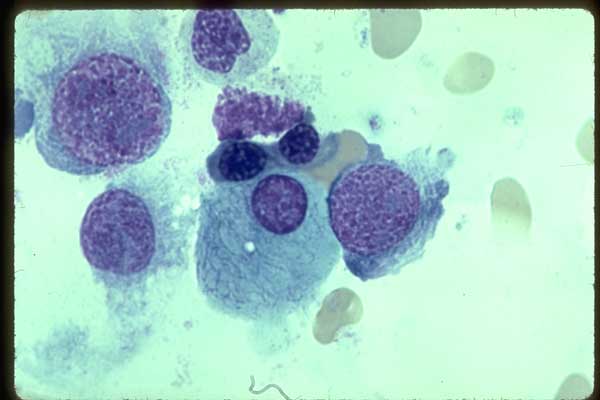
Figure 19. One plasma cell containing a fine network of fibers
that may be outlining stored inmmunoglobulin packets.
Web pages
Databases & Tools
Papers