Materials and Methods
Databases. We obtained the database of the article “Identifying distinct classes of bladder carcinoma using microarrays” from NCBI web page in Gene Expression Omnibus (GEO).
Bladder tumour stage classification is a simple channel database. We just wanted to study the progresion of cancer and this is why we only checked tumour samples Ta, T1 and T2+.
Significant expression values selection. In this step, we studied statistical analysis using R-script. We found this program in the following web page:nin.crg.es/cgi-bin/pMargeWeb.cgi.
First of all, we identified samples corresponding on different stages and we created three files: Ta-T1, T1-T2 and Ta-T2. We obtained p-values. P-value shows differential expression significance. In our study, we selected genes which had a p-value lower than 0.001 (p<0.001) following the next process:
column selection---Data---Filter---Autofilter---Personalized autofilter: “lower than 0.001”.
After this process, we obtained 138 differential expressed genes in Ta-T1 progression, 9 in T1-T2 and 103 genes in Ta-T2. These were the genes analyzed later.
Looking for “Gene Symbol”. We obtained gene symbols using EASE program. These symbols will be very important to analyze results lately.
EASE program was found in DAVID page (Database for Annotation, Visualization and Integrated Discovery). We introduced gene codes in “Input Genes” and we pressed “Annotate Genes”. Apart from obtaining gene symbols, we also obtained some information about functionality and chromosome location.
Clusterings.It is one of the most frequent method used to analyzing information obtained by biochips. This method displays the information in a tree cluster, which is very useful because we can see the results graphically. There is not only one type of clustering method. Here we show the classification and give information of different clusters:
- Hierchichal
- Aglomerative
- Hierchichal tree
- Simple
- Easy visualization Tree View
- K-means
- Divisible
- Number of genes predetermined
- An expression mean vector is calculated
- No trees are obtained
- SOMs (Self Organizing Maps)
- Divisible
- Based in neuronal connections
- Optimisize groups separation using predefined geometry
- Convergence between vectors of each cluster is maximized
In our project, we used hierchichal clustering. First of all, we went to GEPAS (Gene Expression Pattern Analysis Suite) and followed these instructions:
Tools---Preprocessing DNA array data files
We chose Log-transform base 2 (changing negative values to 10 is important) and Standardize patterns. This process normalize our values, which is very important to get good results.
Afterwards, we send to cluster. We selected UPGMA using correlation distance condition.
Genes functionality. To find information about the function of genes and biological processes in which these genes were involved, we used two sources::
- DAVID. In this web page, we went to GOCharts. This program is very useful because it shows graphically gene’s function. We decided to check biological processes and mollecular function because it was the information more interesting for us. We chose level 5 of specificity and 3 for minimal hits (except T1-T2 where we only selected 1 minimal hit because there were just a few genes differentially expressed from T1 to T2).
- FatiGO. We defined the organism: human, we chose mollecular function and we wrote our list of genes. From FatiGO, we obtained graphic results of representative functions.
Using GOCharts and FatiGO, we got information about functionality, but we could use In the previous step, we obtained files containig two columns, one of them had gene symbols and the other one contained corresponding Representative mRNAcess for each gene. To compare our results and the article’s ones, we needed files with just one of the columns. That was the reason why we used these commands in Shell (Unix):
Then, we ordered every list of genes using sort and we eliminated repeated genes using uniq command to avoid mistakes:
Finally, we should identify genes that were common in both studies. We determined if we had obtained the same representative genes than Sanchez-Carbayo or if there were no common genes.
Now, we are going to comment the results that we have obtained:
Gene Discovery in Bladder Cancer Progression using cDNA Microarrays.
According to Sanchez-Carbayo article, significant overexpressed genes would be related on:
- Excretion
- RNA Splicing
- Neurogenesis
- Development
- Attachment proteins
- Lipid metabolism (genes maybe involved in angyogenesis)
- Differentiation epidermical signals like keratin 15
- Immunological response
- Extracellular matrix remodelling
- Oncogenesis
They observe a remarkable repression in genes involved in:
- Cellular adhesion
- Protein modification
- Development+
- Immunological response
- Lipid metabolism
- Attachment proteins
- Oncogenesis
- Transcription regulation
- Cell cycle (p53, pRb, p21)
There are other pathways with a differential expression patterns. These are: checkpoint regulation (for example Cdc16, which is necessary in mitotic spindle formation), and also genes involved in apoptosis.
Identifying distinct classes of bladder carcinoma using microarrays.
Comparing gene expression in different stages they conclude that:
Overexpressed genes are related on:
- transcription
- Nuclear processes
- Proliferation
- Matrix remodelling
- Repressed genes:
- Codify extracellular matrix proteins.
- Are involved in immunologic system
Our results.
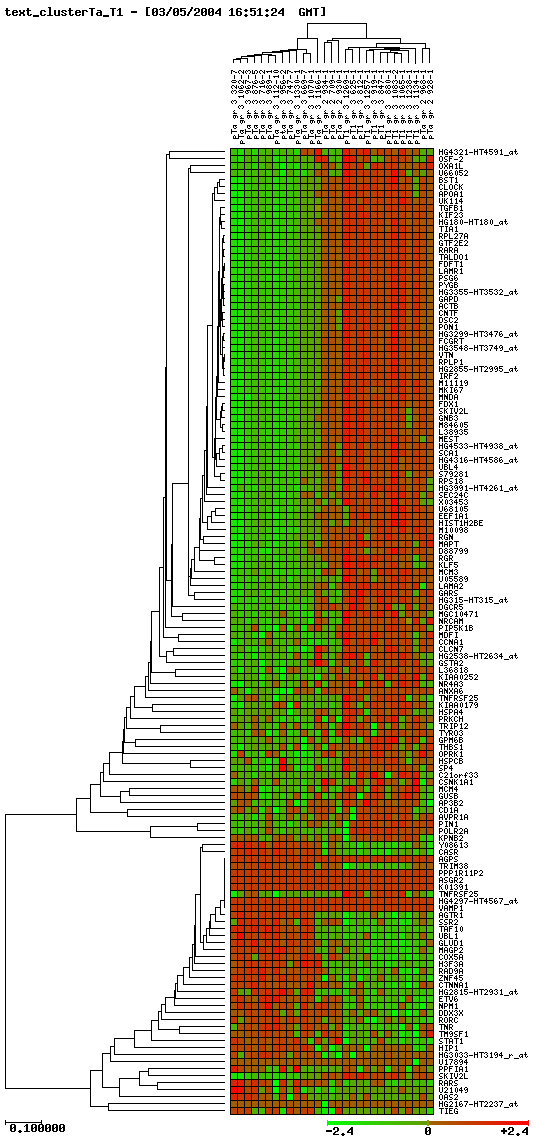
Here we show clusters that we have obtained by taking genes with p-value lower than 0.001:
Cluster progressió Ta-T1
|
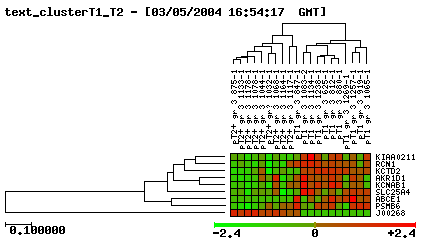
Cluster progressió T1-T2
|
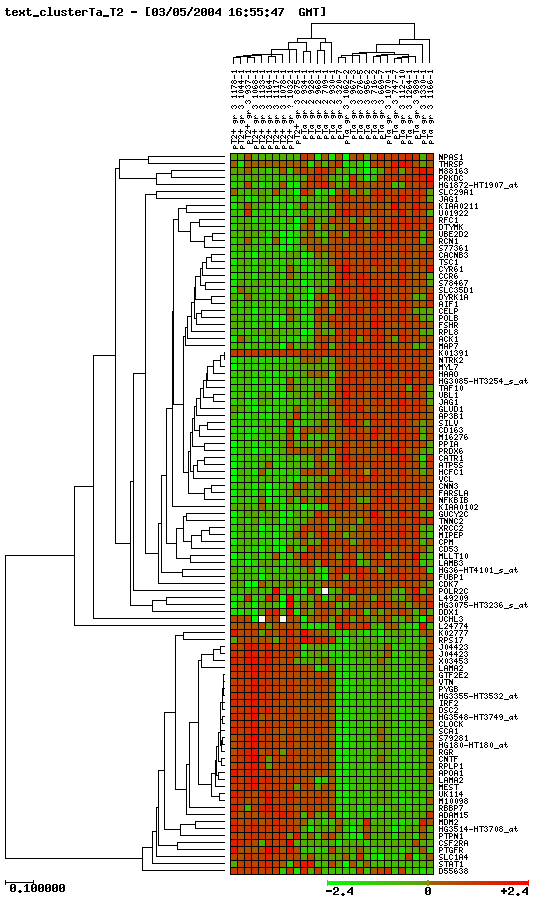
Cluster progressió Ta-T2
|
*You can see images bigger if you click on them.
As we said before in Matherial and Methods, using Shell commands we tried to find genes which were differentially expressed in Sanchez-Carbayo article and in the database of the other article that we analyzed.
Unfortunately, we did not find common genes. Then, we focused our objectives on analyzing the genes which were more significative according to clusters. Below we show chosen genes, their localisation and also their functions.
Genes differentially expressed in Ta-T1 progression:
| Overexpressed
| Gene Symbol
| Chomosome
| Function
|
| ETV6
| 12 |
Member of ETS family transcription factor.
|
| NPM1
| 5 |
RNA-binding nucleolar phosphoprotein.
|
| DDX3X
| X |
DEAD box proteins family. Involved in the beginning of traduction, mithocondrial and nuclear splicing, ribosome complex formation
|
| RORC
| 1 |
Immune system: limphoide embryogenesis.
|
| TNR
| 1 |
Embryonic development.
|
| Repressed
| Gene Symbol
| Chromosome
| Function
|
| DSC2
| 18 |
cadherin family member. It is important in cell-cell unions.
|
| VTN
| 17 |
Involved in adhesion
|
| NR4A3
| 9 |
Transcription activator
|
| MEST
| 7 |
Development
|
.gif)
Genes differentially expressed trogh Ta-T2 progression:
| Overexpressed
| Gene Symbol
| Chromosome
| Function;
|
| LAMA2
| 6
| Extracellular protin which regulates adhesion, migration and cell organization during embryonic development.
|
| VTN
| 17 |
Cell adhesion
|
| MEST
| 7 |
Development
|
| APOA1
| 11
| Lipid metabolism. Enhance cholesterol eflux from tissues to liver tissue.
|
| Repressed
| Gene Symbol
| Chromosome
| Function
|
| CCR6
| 6
| Immune system: Chemokine receptor in T cells and in dendrytic cells.S
|
| AIF1
| 6
| Immune system: Genes induced by citokines and intepheron. This gene is involved in anti-inflammatory responses.
|
| TAF10
| 11
| Transcription begining.
|
| JAG1
| 20
| Development. Receptor notch1 ligand.
|
.gif)
As we can verify, significant genes wih p-values<0.001 have similar functions as compared with representative genes of both articles. Therefore, we can see genes typically related on tumoral processes as for instance genes involved in cell adhesion and genes responsible for decreasing immune system efficacy. We can also see changes in lipid metabolism and deregulation of transcription driving to cell cycle regulation problems.
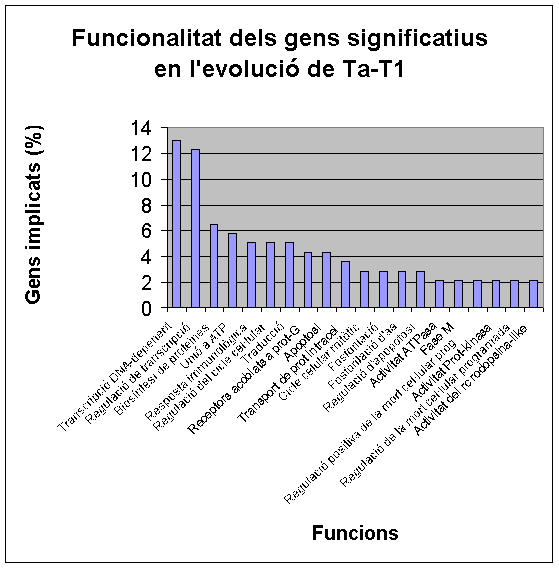
Below, we show FatiGO and GOCharts results. We can confirm what we have already said and it is also important to stand out the importance of cellular programmed death and oncogenesis in cancer.
We conclude that our results about functionality of differentially expressed genes are the same as in both studied articles.