Bioinformàtica - 2on trimestre curs 2003/2004 - UPF
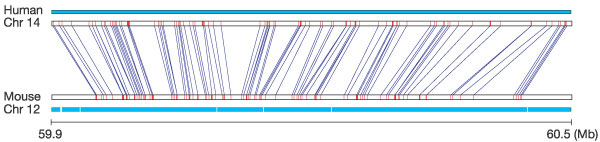
Figure 2
Conservation of synteny between human and mouse. We detected 558,000 highly conserved, reciprocally unique landmarks within the mouse and human genomes, which can be joined into conserved syntenic segments and blocks (defined in text). A typical 510-kb segment of mouse chromosome 12 that shares common ancestry with a 600-kb section of human chromosome 14 is shown. Blue lines connect the reciprocal unique matches in the two genomes. The cyan bars represent sequence coverage in each of the two genomes for the regions. In general, the landmarks in the mouse genome are more closely spaced, reflecting the 14% smaller overall genome size.
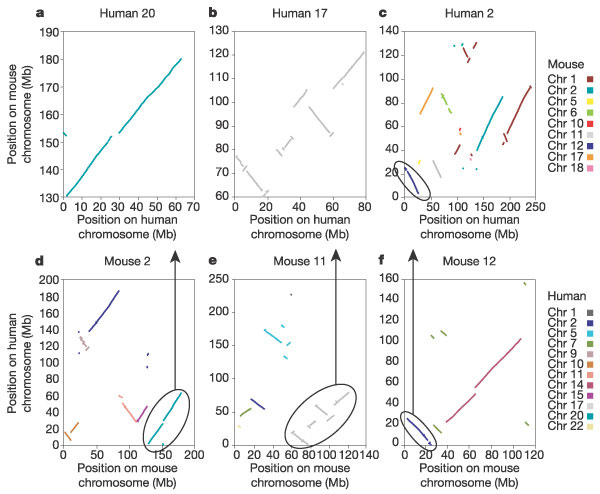
Figure 4
Dot plots of conserved syntenic segments in three human and three mouse chromosomes. For each of three human (a–c) and mouse (d–f) chromosomes, the positions of orthologous landmarks are plotted along the x axis and the corresponding position of the landmark on chromosomes in the other genome is plotted on the y axis. Different chromosomes in the corresponding genome are differentiated with distinct colours. In a remarkable example of conserved synteny, human chromosome 20 (a) consists of just three segments from mouse chromosome 2 (d), with only one small segment altered in order. Human chromosome 17 (b) also shares segments with only one mouse chromosome (11) (e), but the 16 segments are extensively rearranged. However, most of the mouse and human chromosomes consist of multiple segments from multiple chromosomes, as shown for human chromosome 2 (c) and mouse chromosome 12 (f). Circled areas and arrows denote matching segments in mouse and human.
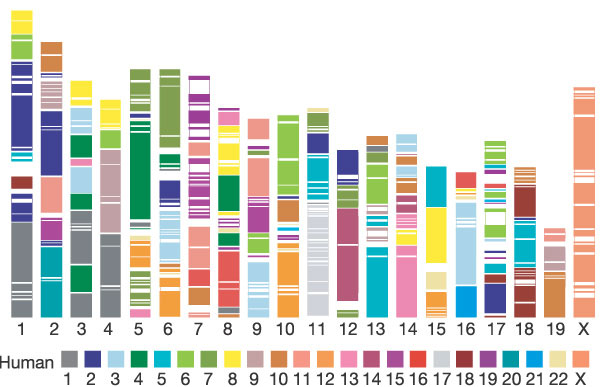
Figure 3
Segments and blocks >300 kb in size with conserved synteny in human are superimposed on the mouse genome. Each colour corresponds to a particular human chromosome. The 342 segments are separated from each other by thin, white lines within the 217 blocks of consistent colour.
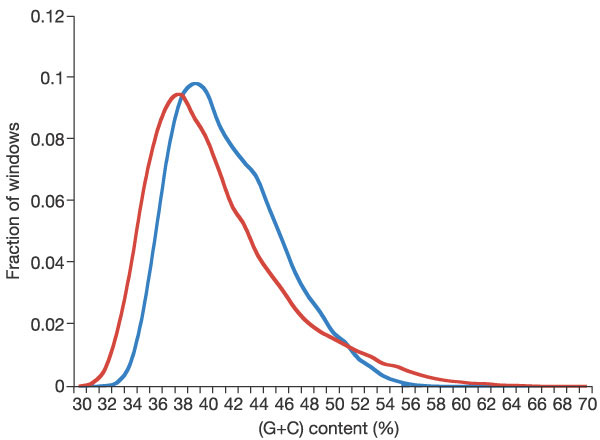
Figure 7
Distribution of (G+C) content in the mouse (blue) and human (red)
genomes. Mouse has a higher mean (G+C) content than human (42%
compared with 41%), but human has a larger fraction of windows with
either high or low (G+C) content. The distribution was determined
using the unmasked genomes in 20-kb non-overlapping windows, with the
fraction of windows (y axis) in each percentage bin (x
axis) plotted for both human and mouse.
4. El DNA repetitiu
5. els gens de ratolí
Aquestes tres fonts de prediccions són combinades en un únic catŕleg,
mitjançant la utilització d'heurístics que permeten conciliar
prediccions que se superposen. El catŕleg resultant és augmentat amb
prediccions del programa Genie, que prediu estructures gčniques en
regions del genoma delimitades per ESTs 3' i 5' aparellats.
6. el proteoma de ratolí
7. l'evolució del genoma: selecció
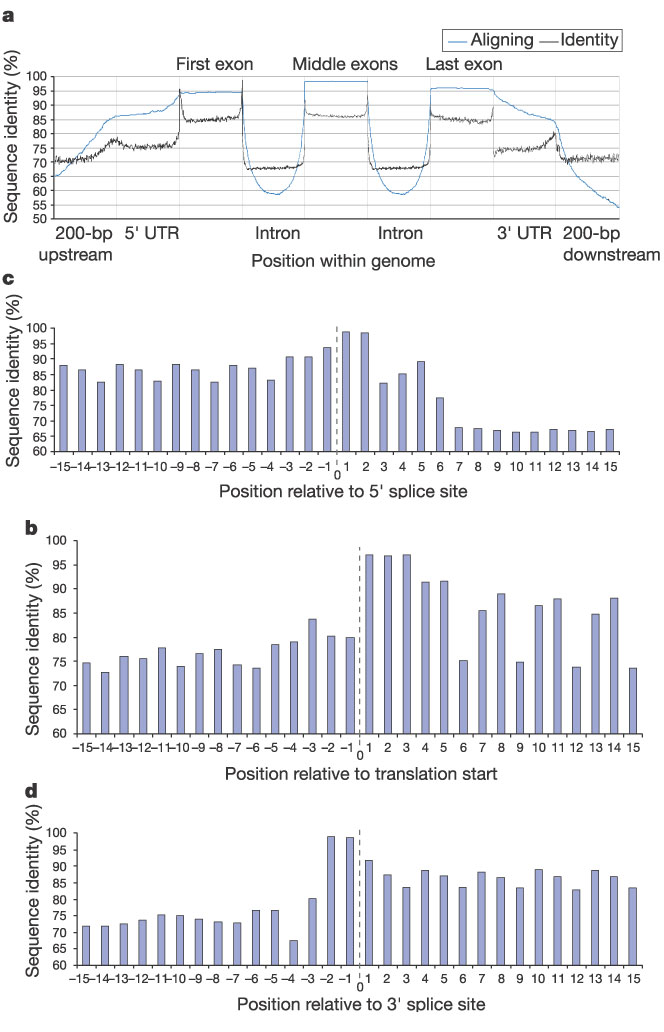
Figure 25
Variation in conservation across a gene. a, Conservation across a generic gene, on the basis of 3,165 human RefSeq mRNAs with known position in the genome. We sampled 200 evenly spaced bases across each of the variable-length regions labelled, resampling completely from regions shorter than 200 bp. The graph shows the average percentage of bases aligning and the average base identity when there is an alignment over each sample. There are peaks of conservation at the transition from one region to another. Here, in contrast to Table 16, only reviewed RefSeq mRNAs were used, and only those having at least 40 bases of annotated 5' and 3' UTRs. The resulting picture, however, is nearly indistinguishable from that obtained by using all RefSeq genes with at least 40 base UTRs. b, Conservation near translation start site using the same data set as in a. The bars show per cent identity of the 15 bases to either side of translation start. Note the extreme conservation of the first codon. After this, there is substantially less conservation at the third codon position. The peak at position -3 corresponds to a purine in the Kozak consensus sequence. c, Conservation near the 5' splice site. The peak of conservation corresponds to the AG/GT consensus at this location, with the first G in the intron being nearly invariant. A G in the fifth base of the intron is also found in a large majority of 5' splice sites. An echo of the variation in the third codon position occurs here because it is common for exons to begin and end at codon boundaries. d, Conservation near the 3' splice site. Conservation in the last two bases of the intron—always AG for introns processed by the major spliceosome—is very apparent. The polypyrimidine tract beginning five bases into the intron is also visibly conserved. Once again, an echo of the variation in the third codon position can be seen.
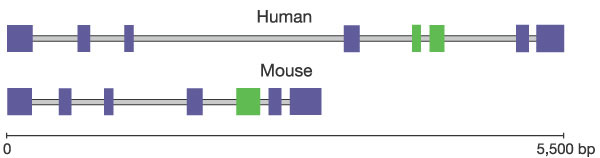
Figure 26
The human spermidine synthase gene (SRM) on chromosome 1, involved in the biosynthesis of polyamines, and its mouse orthologue (Srm) on chromosome 4. The fifth exon in the mouse gene (green) is interrupted by an intron in the human homologue. All other exons are purple.
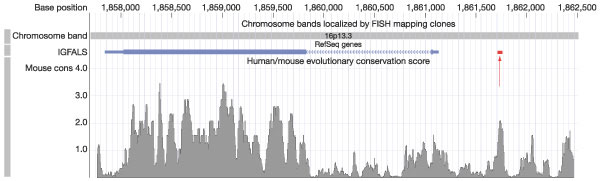
Figure 27
Conservation scores for 50-bp windows in a 4.5-kb region containing the human insulin-like growth factor binding protein acid labile subunit (IGFALS) gene. In the track near the top of figure, the two coding exons of the gene are displayed as taller blue rectangles, UTRs as shorter rectangles, and the intron, which separates the coding exons, is shown as a barbed line indicating direction of transcription (the gene is on the reverse strand). Log probability scores (L-scores) for all 50-bp windows are shown below the gene. The L-score is -log10(p), where p is the probability under the neutral density, Sneutral, of getting a conservation score as high as is observed in the window. Many windows in the coding region get L-scores greater than 3, indicating less than a 1/1,000 chance of occurring under neutral evolution (Pselected(S) > 0.94; see Fig. 28), and some in a local peak in the upstream region of the gene on the right show L-scores greater than 2, indicating less than a 1/100 chance of occurring (Pselected(S) > 0.75). The red bar shows the location of the interferon- -activated sequence-like element (GLE), which is bound by transcription factors from the STAT5a and STAT5b protein family to control expression of this gene244,245. Additional regulatory elements may be located in the other peaks of conservation. This figure is taken with permission from the UCSC browser (http://genome.ucsc.edu).